
Median sales price for homes in Phoenix hits $400,000
June created the perfect trifecta for a hot housing market: June home sales and prices both set report records, while inventory grew for the first time in 15 months. The record-setting industry saw the median sales price for homes in Phoenix hit $400,000, a 30.1% year-over-year increase.
The month of June, typically the biggest month of the year for home sales, saw sales soar 14.2% over a strong May and top all other months in the 13-year history of the report, which spans 53 metro markets. The Median Sales Price of $336,000 was also a report record, eclipsing the previous record of $320,000 – set in April and tied in May – by 4.9%.
The number of homes for sale, meanwhile, grew 1.9% over May – the first increase since March 2020. Inventory, however, still remained 37.5% below June 2020 levels.
“June saw a unique case of supply and demand rising in unison, thanks to an uptick in sellers listing their homes for sale – a very welcome sign for frustrated buyers,” said Nick Bailey, President, RE/MAX, LLC. “People are relocating as companies and individuals make long-term decisions about remote work and getting back to the office. Also, sellers appear to be more confident about finding another home after they sell their current one. If these trends continue, inventory levels should keep growing.”
With year-over-year comparisons skewed by the pandemic, May-to-June averages for 2015-2019 are helpful in illustrating what’s typical at this time of year. June has been the top month for home sales in four of the past six years:
• June 2021 home sales increased 14.2% month over month, more than doubling the 6.4% average gain from May to June in 2015-2019. Year over year, sales were up 26.4%.
• June’s Median Sales Price of $336,000 was 4.9% over May’s, very similar to the typical May-to-June increase of 4.6%. Year over year, June’s price is 21.9% higher than June 2020’s $275,000.
• The 1.9% increase in inventory from May to June was far greater than the typical gain of 0.6%. Still, inventory was down 37.5% year over year.
June’s average Days on Market of 24 was four days less than May’s and represented a faster sale by 21 days compared to June 2020. June’s 1.1 Months Supply of Inventory compares to 1.2 in May and 2.2 year over year.
Highlights and the local markets leading various metrics for June include:
Median Sales Price – Median of 53 metro median prices
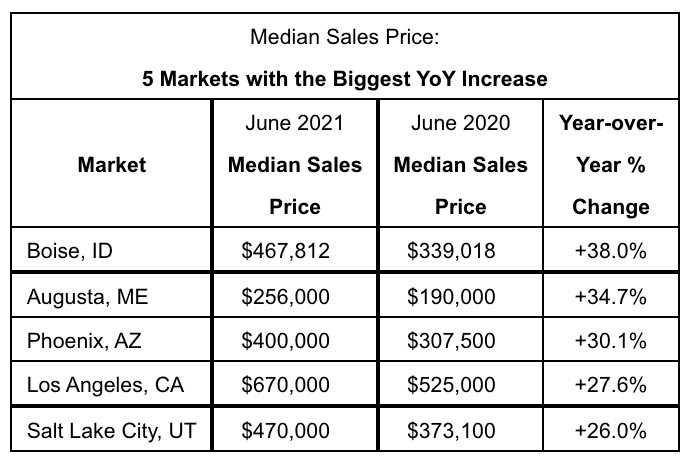
In June 2021, the median of all 53 metro Median Sales Prices was $336,000, up 4.9% compared to May 2021, and up 21.9% from June 2020. Fifty-one metro areas increased year-over-year by double-digit percentages, led by Boise, ID at +38.0%, Augusta, ME at +34.7%, and Phoenix, AZ at +30.1%. No metro areas saw a year-over-year decrease in Median Sales Price.
Closed Transactions
Of the 53 metro areas surveyed in June 2021, the overall average number of home sales is up 14.2% compared to May 2021, and up 26.4% compared to June 2020. Leading the year-over-year sales percentage increases were Honolulu, HI at +92.3%, New York, NY at +80.6%, and Miami, FL at +78.4%.
Months Supply of Inventory – Average of 53 metro areas
The number of homes for sale in June 2021 was up 1.9% from May 2021 and down 37.5% from June 2020. Based on the rate of home sales in June 2021, the Months Supply of Inventory decreased to 1.1 compared to 1.2 in May 2021, and decreased compared to 2.2 in June 2020. A six months supply indicates a market balanced equally between buyers and sellers. In June 2021, of the 53 metro areas surveyed, zero metro areas reported a months supply at or over six. The lowest Months Supply of Inventory was a five-way tie among Albuquerque, NM; Raleigh-Durham, NC; Manchester, NH; Denver, CO; and Seattle, WA at 0.5.
Pandemic cut traffic congestion in Phoenix area
Phoenix area commuters got 36 hours of their lives back last year.
That’s the amount of time Valley residents did not have to spend sitting in traffic, as the COVID-19 pandemic led to sharp drops in commuting and subsequent declines in traffic congestion, according to a new national report.
Cities across Arizona, and across the U.S., saw drops of 50 percent or more in the number of hours and dollars they wasted sitting in traffic, as well as a reduction in gasoline burned while idling in a traffic jam, said the report last week by the Transportation Institute at Texas A&M University.
“Peak or rush hour traffic aren’t quite as bad as they were,” said Eric Anderson, executive director at Maricopa Association of Governments. “What that means is we have more people not commuting during rush hour as we did prior to the pandemic which reflects the fact that a lot of people are still working from home.”
But experts say drivers should enjoy it while they can, as numbers have already started to creep back up toward previous levels. While it may not immediately reach the levels of 2019, the report said that 2021 “will see faster congestion growth than any time since 1982.”
But in 2020, the time people spent stuck in traffic was at the lowest level since 1988, when a typical U.S. commuter spent an extra 26 hours behind the wheel.
Last year, the number fell to 27 hours, a 50 percent drop from the 54 hours stuck commuting in 2019, according to the 2021 Urban Mobility Report.
Luke Albert, associate research engineer with the Transportation Institute, attributed the drop to the number of people teleworking, which spread the number of cars and trucks on the highway out over the course of the day.
As the report put it, while cities were “focused on ‘flattening the curve’ to address the pandemic health emergency, they also flattened the travel-delay curve.”
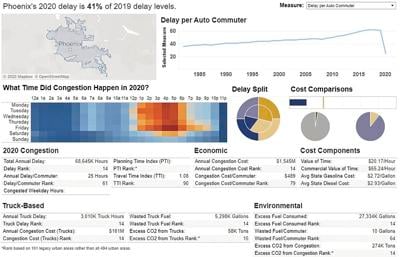
For example, the report said that commuters in the Phoenix-Mesa region who drove to work between 6 and 10 a.m. and drove home between 3 and 7 p.m. spent 36 fewer hours stuck in traffic in 2020 than they did in 2019, a 59 percent drop.
The numbers were similar in Tucson, where the 21 hours spent stuck in traffic last year was down 58 percent from the year before.
While smaller cities across the state had shorter commutes, they all saw similar declines in delays from 2019. In Avondale-Goodyear, commuting delays fell from a total of 23 hours to 14 hours last year, while commuters in Flagstaff and Prescott “wasted eight hours sitting in traffic in 2020,” according to the report.
Every city in the state saw at least a one-third decline in hours spent in traffic congestions.
It was not just time that was saved. Nationally, the report said commuters burned an extra 3.5 billion gallons of gas in 2019 from traffic that was not moving at “free-flow speeds,” but that number fell to 1.7 billion gallons last year. Congestion-caused greenhouse gas emissions fell from 36 million tons to 18 million tons.
The cost of all that sitting adds up: The report said traffic congestion cost Americans $190 billion of extra fuel and lost time in 2019, compared to $101 billion last year. That’s a drop in per-commuter expenses from $1,170 to $605.
Anderson said he expects “higher telecommuting” that started during the pandemic to continue into the future, as many employers and employees have found they can work remotely.
Encouraging people to take up alternative work schedules by working remotely – partially or fully – would “take vehicles off the system and help our (Arizona’s) congestion levels,” he said.
Additionally, many people commute downtown from the West Valley for work every day. Creating more job opportunities in the West Valley would “reduce long-distance commuting patterns and take pressure off the system,” Anderson said. That is one way the state can prepare for the “return of congestion problems” predicted in the report.
But while experts see traffic congestion returning, Albert said it is not likely to reach pre-pandemic levels – right away.
“We definitely have noticed and expect increases in 2021,” Albert said. But “we don’t
expect it to be all the way back to 2019” because it’s unclear how many people will continue to work remotely, he said.