What’s Up in Housing? A Phoenix Market Snapshot

Is business good or is it poor? Is it a buyer’s market or a seller’s market? It all depends on how you look at things, but both agents in the field and my friends at the Cromford Report say we’ve entered a buyer’s market. The concepts are pretty simple: if there are more homes available (supply) than buyers who are shopping (demand), buyers tend to have the upper hand resulting in a buyer’s market. When the supply of homes is low and there are a lot of buyers, we have a seller’s market. Below, we can see the Cromford Index dashboard for February 23, 2014 indicating a buyer’s market, as it has for the past two weeks.
Cromford Market Index, February 23, 2014
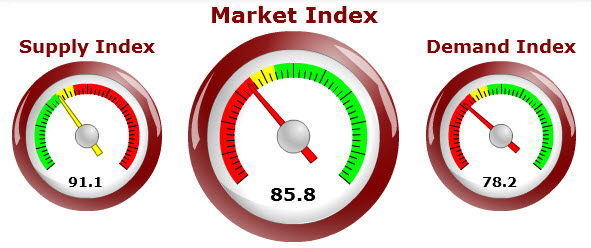
www.CromfordReport.com, used by permission
The Cromford report data also shows a balanced Market Index between 90 and 110—the colors aren’t “good” or “bad,” green simply indicates a seller’s market and red means a buyer’s market. I should point out that the Cromford Report indices are very complex and the data reflects many different variables over several years.
Although the greater Phoenix area is made of up of many sub-markets, some general trends appear:
- Active listings have been increasing since the summer of 2013 and are well-above February 2013 levels.
- On the other hand, sales are much lower than (about half) last summer’s levels. The picture I get from agents in the field is that sellers are looking at the big run-up in prices over the last 18 months1 and still have unrealistic expectations—they don’t realize demand is weakening.
- It’s difficult to convince sellers to lower prices, so many agents are suggesting concessions to attract buyers.
When will prices be coming down? In fact, they have already begun to edge down. The recent median price peak of $185,000 of last summer has edged down to $180,000, the number of price cuts per week has increased by about 50 percent from February 2013 and the current ratio of final price to list price is 97 percent. It seems a little counter-intuitive that price per square foot continues to creep up, but a look at price ranges reveals most of that increase comes from homes priced over $500,000. Also, since appraisals tend to look at recent sales and current pricing, valuations will continue to lag the actual market.
So what’s up? Prices, though with the current trend toward a buyer’s market, prices will need to come down some to motivate buyers. Some good news about jobs and consumer confidence would help, too. Most analysts I talk with are saying that Phoenix housing prices are more likely to stabilize or decrease some in 2014, but mortgages will stay affordable. Things aren’t great, but they’re not bad, either. It’ll be an interesting year.
What do you think? What’s it like in your area? Leave a comment below or email me at ronlamee@aaronline.com.
1 $79/square foot in September 2011; currently $128/square foot; median price $113,500 in September 2011, currently $180,000.
The Case-Shiller Home Price Index for the end of 2013 came out February 25, 2014. Although the data shows an increase in the Phoenix index of over 15 percent for 2013, it shows a quarter percent decline in the Phoenix index from November to December, the first decline in a couple years. This may give agents a bit more ammunition when approaching their sellers for realistic pricing.